Sales Reports and Dashboard
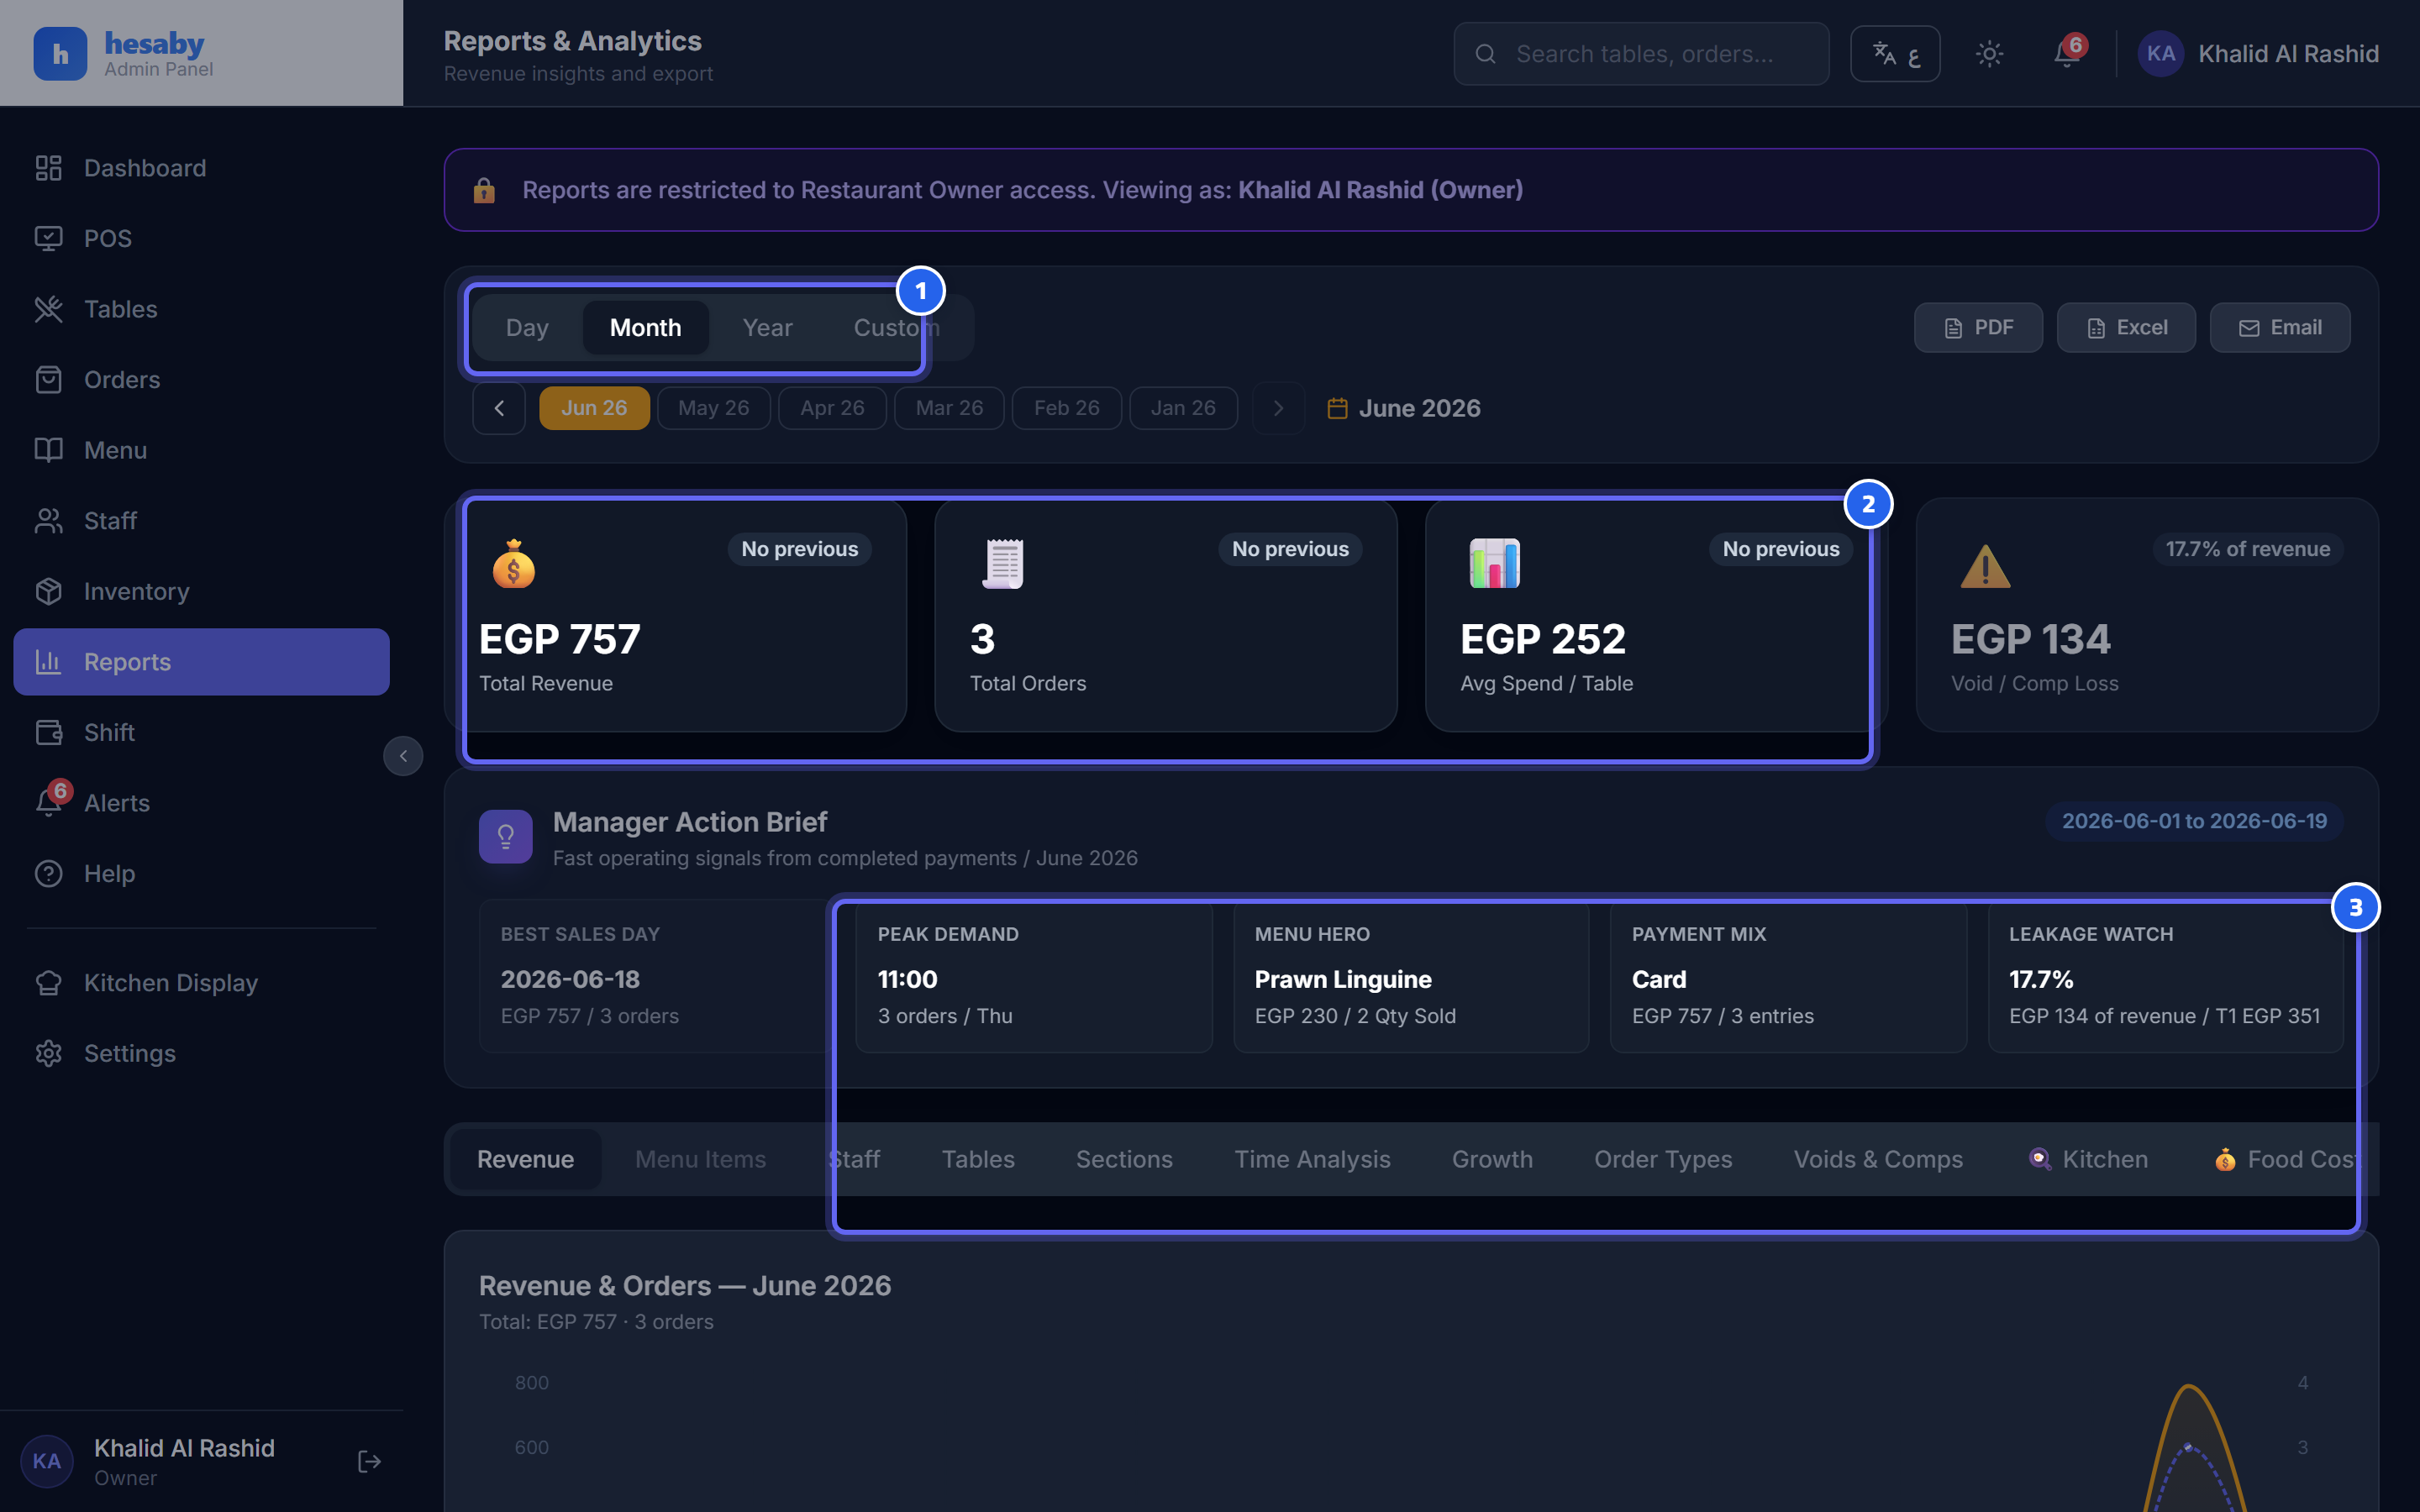
- Choose sales by day or by date range here
- Summary of revenue, orders, and average spend
- Analytics: peak hours and payment-method breakdown
Dashboard
A quick look at today's performance: sales, number of orders, average check, and a comparison with yesterday.
Sales Reports
From Admin Panel → Reports: - Sales by day or by date range. - An hourly heatmap (peak hours). - Top-selling items.
Important: the Cairo-time business day
All reports aggregate data by the Cairo-time business day — so "today's" sales are correct even for orders placed after midnight.
The figures reflect actual revenue (with refunds deducted) — not just the sum of checks.
Next: Z-report